
To view this content you must be an active member of the TAN Association.
Not a member? Join the TAN Association and unlock access to hundreds of hours of written and video technical analysis content, including the Journal of Technical Analysis and the Video Archives. Learn more about Membership here.
What's Inside...
WHY CAN’T MOST PEOPLE BUY THE ALL TIME HIGH?
by Thomas Vician, CMTProfit presumes the existence of trend. All market participants attempting to profit are trend followers. It’s optional to hold these beliefs. Introduction Trend following makes sense and...
BLOOMBERG BRIEF HIGHLIGHTS: WILLIAMS TECHNICAL STRATEGY OUTPERFORMS IN TRADING FTSE OVER PAST YEAR
by Oliver Woolf, CMT, CAIA, FRMEditor’s note: This material was originally published in the October 13, 2016 issue of Bloomberg Brief: Technical Strategies. Below are extracts from that Brief. In a previous edition of...
INFLATION IS COMING
by Greg Harmon, CMTEditor’s note: this was originally posted at Dragonfly Capital on October 18th, 2016. Inflation is coming, and Janet Yellen is now getting scared. Makes for a great lead doesn’t it? The Fed...
HIGHER PROBABILITY COMMODITY TRADING BY CARLEY GARNER
by Michael Carr, CMT & Carley GarnerThe book begins with a provocative point: With unlimited money, it would be hard to lose trading commodities. Carley explains, “Knowing the nature of commodity boom and bust cycles, a trader with...
A LONG-TERM PERSPECTIVE ON BONDS
by Ken Winans, CMTEditor’s note: this information is extracted from the second edition of Investment Atlas: Financial Maps to Investment Success. For additional information on market history, please visit...
100 YEARS OF MARKET STRUCTURE IMPROVEMENT
by Phil Mackintosh & Ka Wo ChenEditor’s note: this was originally published by KCG at KCG.com. KCG offers services designed to address trading needs across asset classes, product types and time zones. The firm is one of the...
TRADING U.S. OPENING GAP IN ASIA HOURS
by Gabriel Kan & Kei Gamo & Tom KingsleyEditor’s note: this originally appeared at Bloomberg Tradebook on Sept. 22, 2016. A brief extract is reposted here. For the full post, please click here. The risk of holding a U.S. equity position...
CHART OF THE MONTH
The Charles H. Dow Award is presented annually for outstanding research in technical analysis. As the 2014 winners, Michael Gayed, CFA, and Charles Bilello, J.D., CPA, CMT, demonstrated, research can...
WHY CAN’T MOST PEOPLE BUY THE ALL TIME HIGH?
Profit presumes the existence of trend.
All market participants attempting to profit are trend followers.
It’s optional to hold these beliefs.
Introduction
Trend following makes sense and money. Yet most traders, investors, and portfolio managers cannot do it. People fail to implement many important components of trend following systems. One such component is the historical price breakout. Most avoid it. Many decry it. Successful trend followers buy it.
Why can’t most people buy the all-time high?
Hypothesis
The difficulty is emotional. People who are unwilling to fully experience uncomfortable feelings inhibit themselves from buying historical breakouts.
Explanation of Hypothesis
The historical breakout is one of trend following’s important entry signals. However, this event triggers very uncomfortable feelings by its very nature. Most persons avoid historical breakouts to sidestep having to experience untenable emotions. People do not like, or negatively judge, these feelings that arise. With this negative judgment present, people become
To view this content you must be an active member of the TAN Association.
Not a member? Join the TAN Association and unlock access to hundreds of hours of written and video technical analysis content, including the Journal of Technical Analysis and the Video Archives. Learn more about Membership here.
Contributor(s)

Thomas Vician, CMT
Tom Vician, who holds the Chartered Market Technician (CMT) designation, manages fully quantitative fixed income, broad equity, and dividend income programs along with a semi-systematic growth equity strategy for the $100M SHC Financial. This includes system design,...
BLOOMBERG BRIEF HIGHLIGHTS: WILLIAMS TECHNICAL STRATEGY OUTPERFORMS IN TRADING FTSE OVER PAST YEAR
Editor’s note: This material was originally published in the October 13, 2016 issue of Bloomberg Brief: Technical Strategies. Below are extracts from that Brief.
In a previous edition of the Technicals Strategies Quarterly, a profitable strategy using a Z score on the implied volatility skew for the FTSE 100 was explained. The strategy assumes spikes in the skew represent extremes in sentiment, and hence mean reversion opportunities. The strategy goes long the FTSE when the Skew Z Score crosses below +2 standard deviation and short at -2 (positions liquidated at 0). Over the last three years the strategy would have generated a 214% return, with a winning ratio of 88% and a Sharpe ratio of 2.27, the back test shows.
On a pure price basis, a technical indicator that tends to perform well in such environments is the Williams %R, developed by Larry Williams. The image below, from the BTST scatter plot tab,
To view this content you must be an active member of the TAN Association.
Not a member? Join the TAN Association and unlock access to hundreds of hours of written and video technical analysis content, including the Journal of Technical Analysis and the Video Archives. Learn more about Membership here.
Contributor(s)

Oliver Woolf, CMT, CAIA, FRM
Oliver Woolf, who holds a Chartered Market Technician (CMT) designation, is a Technical Analysis & Data Visualization Specialist at Bloomberg. Working closely with the company's product development team at the forefront of financial technology with big data, he advises...
INFLATION IS COMING
Editor’s note: this was originally posted at Dragonfly Capital on October 18th, 2016.
Inflation is coming, and Janet Yellen is now getting scared. Makes for a great lead doesn’t it? The Fed appears to be on hold until after the election with pressure building to make a move by raising rates. So no wonder Janet looks scared. If inflation is rising then her committee might fall behind and need to move faster to get back in control. That is historically how it has worked though. Talk a big game of staying in front of inflation but lag the actual move and need to catch up.
Enough of the history lesson though. It does look like inflation may be building. I get my evidence from the chart below of the CRB Index. This used to be the Fed’s go to measure of inflation before the PCE thing was created. After 4 years
To view this content you must be an active member of the TAN Association.
Not a member? Join the TAN Association and unlock access to hundreds of hours of written and video technical analysis content, including the Journal of Technical Analysis and the Video Archives. Learn more about Membership here.
Contributor(s)

Greg Harmon, CMT
Gregory W. Harmon, who holds a Chartered Market Technician (CMT) designation, is the President and Founder of Dragonfly Capital Management, LLC, a company that provides daily technical analysis of securities markets and consulting services to the marketplace. Greg was previously...
HIGHER PROBABILITY COMMODITY TRADING BY CARLEY GARNER
The book begins with a provocative point:
With unlimited money, it would be hard to lose trading commodities.
Carley explains, “Knowing the nature of commodity boom and bust cycles, a trader with immense pain tolerance, financial capital, patience, and discipline to accept massive drawdowns in exchange for nearly certain trading success might “never” lose money trading commodities.”
This is a bold statement but it is true and it is unique to commodity trading. It does not apply to any other investment. Stock markets provide investors with ample opportunities to find long-term losers as do corporate or municipal bond markets. In extreme cases, sovereign debt has been wiped out and currency traders have also been bankrupted by government decisions. Commodities are unique in that they exhibit a boom and bust cycle that has repeated
To view this content you must be an active member of the TAN Association.
Not a member? Join the TAN Association and unlock access to hundreds of hours of written and video technical analysis content, including the Journal of Technical Analysis and the Video Archives. Learn more about Membership here.
Contributor(s)

Michael Carr, CMT
Mike Carr, who holds a Chartered Market Technician (CMT) designation, is a full-time trader and contributing editor for Banyan Hill Publishing, a leading investment newsletter service. He is an instructor at the New York Institute of Finance and a contributor to various...

Carley Garner
Carley Garner is the Senior Commodity Strategist for DeCarley Trading, a division of Zaner, where she also works as a commodity broker. She has written multiple books on futures and options trading, the latest is titled Higher Probability Commodity Trading. Garner also...
A LONG-TERM PERSPECTIVE ON BONDS
Editor’s note: this information is extracted from the second edition of Investment Atlas: Financial Maps to Investment Success. For additional information on market history, please visit KenWinans.com.
Below are charts showing the price and interest yields of U.S. corporate bonds and the total return (annual price change and interest earned combined) adjusted for inflation since 1862.
Unlike common stocks, where most profits are made through increases in the value of the shares, the price of bonds oscillates around the maturity value (or par value) of $1,000 per bond, thus showing only a small change in bond values over the past 153 years.
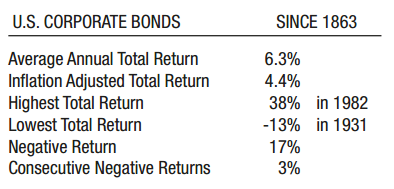
The real profit power of bonds comes through the regular interest paid to the investor by the company that issued the bond. This has averaged 6.3% since 1862 for a total interest
To view this content you must be an active member of the TAN Association.
Not a member? Join the TAN Association and unlock access to hundreds of hours of written and video technical analysis content, including the Journal of Technical Analysis and the Video Archives. Learn more about Membership here.
Contributor(s)

Ken Winans, CMT
Ken Winans, CMT President & Founder, Winans Investments For 28 years, Ken Winans, CMT, has conducted groundbreaking financial research within the discipline of technical analysis while serving as a portfolio manager, investment analyst, broker and investor. Ken is the...
100 YEARS OF MARKET STRUCTURE IMPROVEMENT
Editor’s note: this was originally published by KCG at KCG.com. KCG offers services designed to address trading needs across asset classes, product types and time zones. The firm is one of the world’s largest independent market makers.
Crib Sheet:
The US Equity market is the most liquid and arguably the cheapest in the world for long-term investors. It is also a market where ETFs and hedge funds thrive. No single event got us here – it’s been a process of constant refinement and learning. Three consistent factors have contributed:
- Innovation
- Competition
- Regulation
Since the invention of the telegraph in 1832, technology has had a disruptive influence on market structure. Often, regulators have had to step in to require incumbents to adopt technology, spend on productivity enhancements and break down exclusive access.
Now nearly all trading is done electronically, which has changed how trading is done as well as who can do it. Those who have
To view this content you must be an active member of the TAN Association.
Not a member? Join the TAN Association and unlock access to hundreds of hours of written and video technical analysis content, including the Journal of Technical Analysis and the Video Archives. Learn more about Membership here.
Contributor(s)

Phil Mackintosh
Ka Wo Chen
TRADING U.S. OPENING GAP IN ASIA HOURS
Editor’s note: this originally appeared at Bloomberg Tradebook on Sept. 22, 2016. A brief extract is reposted here. For the full post, please click here.
The risk of holding a U.S. equity position overnight, measured by the difference between previous day’s closing price and market opening price, has increased by more than seven times in the last four years from 2.3bp in 2012 to 17.5bp in 2016 H1. The overnight gap risk is trending towards the 2008 financial crisis level at 28.1bp.
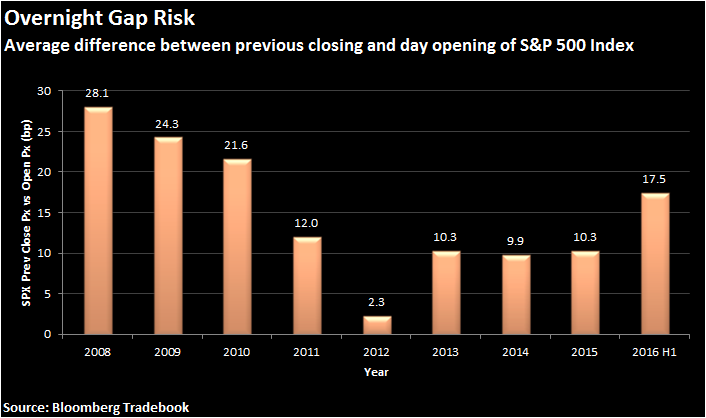
For a strategic trader, the gap risk in the U.S. equity market represents opportunity to profit from the information revealed in Asia. The signal from Asia appears to be even stronger if the intraday move is larger. If Nikkei-225 index changes by more than 1% from open to close, its correlation to
To view this content you must be an active member of the TAN Association.
Not a member? Join the TAN Association and unlock access to hundreds of hours of written and video technical analysis content, including the Journal of Technical Analysis and the Video Archives. Learn more about Membership here.
Contributor(s)
Gabriel Kan
Kei Gamo
Tom Kingsley
CHART OF THE MONTH
The Charles H. Dow Award is presented annually for outstanding research in technical analysis. As the 2014 winners, Michael Gayed, CFA, and Charles Bilello, J.D., CPA, CMT, demonstrated, research can be put to practical use. They have used the analysis presented in their paper to manage mutual funds and separately managed accounts and have now created an index to track the results of their analysis.
In their 2014 Charles H. Dow Award winning paper “An Intermarket Approach to Beta Rotation,” they outlined an indicator that switches in and out of the S&P 500 based on the recent price action of the utilities index. The chart below demonstrates that this idea could be used to time the market and also demonstrates Gayed and Bilello’s idea continues to work in the current market environment.
To view this content you must be an active member of the TAN Association. 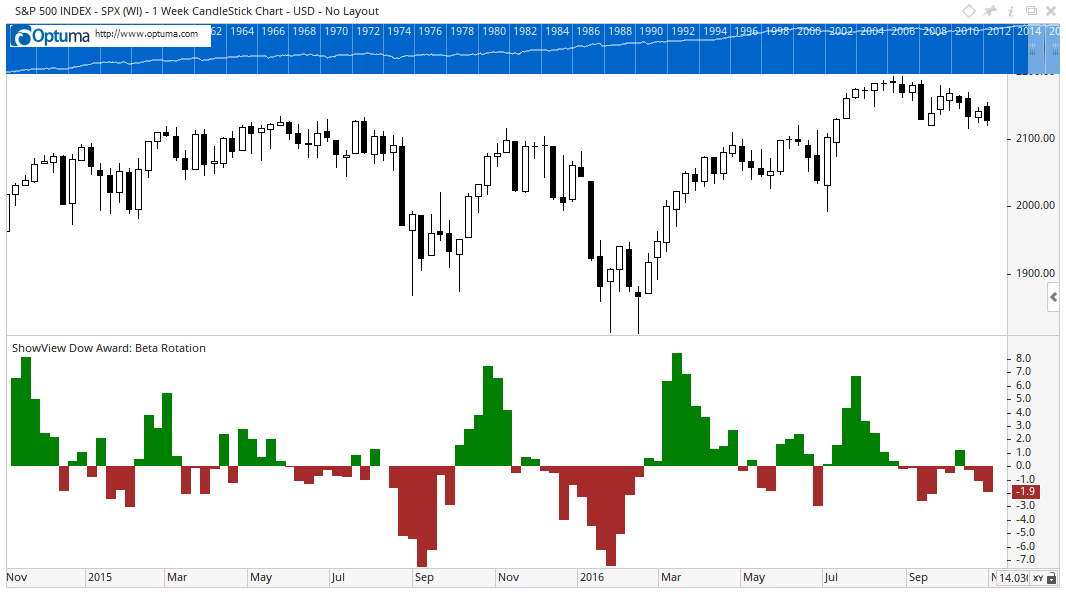
Not a member? Join the TAN Association and unlock access to hundreds of hours of written and video technical analysis content, including the Journal of Technical Analysis and the Video Archives. Learn more about Membership here.
New Educational Content This Month
-
August 26, 2020

The CMT Experience
Presenter(s): Tyler Wood, Dave Lundgren, CMT, CFA
-
August 26, 2020
Reading the Current Market in Light of History’s Lessons
Presenter(s): Ryan Detrick, CMT
-
August 12, 2020
How to Spot Major Trend Reversals with Elliott Waves and Socionomics: Examples from Asia’s Ongoing Secular Bull Market
Presenter(s): Mark Galasiewski