
LETTER FROM THE EDITOR
Traders around the world are reacting to what they think the Federal Reserve might do in the coming months. Fed officials have repeatedly tried to calm the markets by explaining they have no firm plans for managing the end of their latest Quantitative Easing initiative. For some reason, traders seem to be nervous about assurances. No one really seems to know what will happen next.
In this month’s newsletter, we have the insights of technicians from around the world. We are able to feature assessments of markets in the U.S., Canada, and the Philippines. We also have several charts showing the recent activity in India.
Hopefully in the future we can provide analysis of markets in other countries. There are now MTA Members in 85 countries. We have no way of knowing where the next global hot spot will be but we can be fairly certain an MTA member will be providing analysis on that market. If you prepare reports on some of the less widely covered markets, or on the more
they have no firm plans for managing the end of their latest Quantitative Easing initiative. For some reason, traders seem to be nervous about assurances. No one really seems to know what will happen next.
In this month’s newsletter, we have the insights of technicians from around the world. We are able to feature assessments of markets in the U.S., Canada, and the Philippines. We also have several charts showing the recent activity in India.
Hopefully in the future we can provide analysis of markets in other countries. There are now MTA Members in 85 countries. We have no way of knowing where the next global hot spot will be but we can be fairly certain an MTA member will be providing analysis on that market. If you prepare reports on some of the less widely covered markets, or on the more
To view this content you must be an active member of the TAN Association.
Not a member? Join the TAN Association and unlock access to hundreds of hours of written and video technical analysis content, including the Journal of Technical Analysis and the Video Archives. Learn more about Membership here.
What's Inside...
MEAN REVERSION INDEXING
by Mukul PalEditor’s note: This paper was originally published at http://ssrn.com/abstract=2050301 and is reprinted here with the permission of the author. Abstract: In their 1985 paper Does the stock market...
INTERVIEW WITH BRETT VILLAUME, CMT
by Brett Villaume, CMT, CAIA & Amber Hestla-BarnhartHow would you describe your job? I’m a sell-side research analyst with a boutique broker/dealer called FIG Partners, which specializes in bank stocks. I have been with the company for nine years...
THE SUN CONTINUES TO SHINE ON THE MARKETS
by Ron MeiselsEditor’s note: This report was originally published by Phases & Cycles on August 27, 2013 and is reprinted here with permission. If there is one thing that the 2009-13 bull market has taught us...
ETHICS CORNER: “YOU CAN WIN 90% OF THE TIME WITH THIS MARKET TIMING TOOL”
by Michael Carr, CMTI recently saw a marketing pitch from a nonmember of the MTA which offered to reveal how to win 95% of the time with a special technique that would be revealed to me as soon as my credit card could...
MEMBER PROFILE: DR. JULIE DAHLQUIST, PH.D., CMT
by Amber Hestla-BarnhartJulie Dahlquist is first and foremost a teacher. She may not try to be teaching all the time but she taught me a great deal in a short time. Great teachers have the ability to make complex ideas easy...
THE TECHNICAL TAKE
by Robert DombrowerEditor’s note: This is an extract of an internal, weekly macro technical research report written solely to address the concerns of the Quantitative Strategies Group (QSG) at ICC Capital Management...
VISUAL GUIDE TO ELLIOTT WAVE TRADING
by Wayne Gorman & Jeffrey Kennedy, MSTA, CFTe, CMT, CEWA-M & Michael Carr, CMTElliott Wave is often thought of as a comprehensive market philosophy. It can be applied as a self-contained analytical tool but Gorman and Kennedy demonstrate that Elliott Wave can be combined with...
Q&A WITH WAYNE GORMAN
Editor’s note: After reading the book, I wanted to know more about how to trade Elliott Wave. Wayne kindly answered several questions and his answers may help others trying to incorporate Elliott...
AN OVERVIEW OF MARKET ACTION IN THE PHILIPPINES
by Ron Acoba, CMTPhilippines Stock Exchange PSEi Index Outlook Editor’s note: This analysis was prepared on August 28, 2013. The PSEi fell as low as 5,562 in today’s trading following last night’s sell-off of...
CHART OF THE MONTH
This month, several charts are shown to allow for a more detail look at India. A number of news stories have pointed out that rapid changes in the exchange rate of the Indian Rupee could lead to...
MEAN REVERSION INDEXING
Editor’s note: This paper was originally published at http://ssrn.com/abstract=2050301 and is reprinted here with the permission
of the author.
Abstract: In their 1985 paper Does the stock market overreact? DeBondt and Thaler explained the idea of mean reversion. They illustrated how mean reversion leads to the “Loser’s portfolio” outperforming the “Winner’s portfolio”over a 3-year period. Based on mean reversion, this paper asserts a new stock selection and trend determining approach. DeBondt and Thaler use an innovative approach to convert price performance data into nonprice ranking data, which is positively tested for mean reversion and stationarity.
Introduction: Findings of reversion in stock prices towards some fundamental values remained in the literature for a decade. Using overreaction, DeBondt and Thaler (1985) showcased that a stock which performed poorly over a 3-5 year period subsequently tended to outperform securities that performed well relative to the average, during that same period. This implies that, on average,
To view this content you must be an active member of the TAN Association.
Not a member? Join the TAN Association and unlock access to hundreds of hours of written and video technical analysis content, including the Journal of Technical Analysis and the Video Archives. Learn more about Membership here.
Contributor(s)

Mukul Pal
Mukul Pal, a technical analyst who holds the Chartered Market Technician (CMT) designation, is the founder of AlphaBlock, a technology group focused on bringing the predictive mapping characteristics of AI to the market mechanisms that use blockchain to create an adaptive...
INTERVIEW WITH BRETT VILLAUME, CMT
How would you describe your job?
I’m a sell-side research analyst with a boutique broker/dealer called FIG Partners, which specializes in bank stocks. I have been with the company for nine years now and work out of the firm’s satellite office in San Francisco. My job entails covering publicly-traded companies on the West Coast, which includes estimating future earnings, or EPS estimates, and coming up with price targets and formal stock recommendations. It’s a very typical sell-side fundamental analyst job, although FIG Partners prides itself on its grass roots approach and generally more high touch service due to its smaller size.
I am also considered to be FIG’s Technical Analyst, providing daily market commentary to the sales team and our institutional clientele and advising them on stock ideas from a technical perspective. I speak on the morning sales call every day about what’s going on with the broad market indices, the three
To view this content you must be an active member of the TAN Association.
Not a member? Join the TAN Association and unlock access to hundreds of hours of written and video technical analysis content, including the Journal of Technical Analysis and the Video Archives. Learn more about Membership here.
Contributor(s)

Brett Villaume, CMT, CAIA
Brett Villaume, CMT, CAIA, is Vice President of the TAN Association and has served on the Board of Directors since 2014. Additionally, Brett is Senior Vice President and Director of Investor Relations of Opus Bank, a regional commercial bank headquartered in Irvine,...

Amber Hestla-Barnhart
THE SUN CONTINUES TO SHINE ON THE MARKETS
Editor’s note: This report was originally published by Phases & Cycles on August 27, 2013 and is reprinted here with permission.
If there is one thing that the 2009-13 bull market has taught us over and over again, it is to not underestimate its persistence and refusal to buckle to bearish forces.
Recent action for the S&P 500 could be summarized as follows: after a modest four-week correction to 1560 in late-June (an approximate 1/3 correction of the November-May rally), the Index moved to an all-time high and is now into the second down-leg but already becoming over-sold. This is exemplified by: 1) the recent –75% reading on the Advance-Decline oscillator, 2) the minus six (bullish) reading on the Net Day (or Meisels) Index, 3) the dearth of New Highs (a mere 11 on August 15th), and 4) the almost over-sold status of the Slow Stochastic.
In all probability, the sell-off culminated last
To view this content you must be an active member of the TAN Association.
Not a member? Join the TAN Association and unlock access to hundreds of hours of written and video technical analysis content, including the Journal of Technical Analysis and the Video Archives. Learn more about Membership here.
Contributor(s)

Ron Meisels
Ron Meisels is Founder and President of Phases & Cycles Inc. with over 50 years of stock market experience. He specializes in the independent research of Canadian and U.S. securities and market using Behavior Analysis. Institutions ranked him among the top...
ETHICS CORNER: “YOU CAN WIN 90% OF THE TIME WITH THIS MARKET TIMING TOOL”
I recently saw a marketing pitch from a nonmember of the MTA which offered to reveal how to win 95% of the time with a special technique that would be revealed to me as soon as my credit card could be processed. There was no information about which markets I would be a big winner in and the typical holding period were not defined. Several sample charts were shown with dark lines that appeared to be some type of indicators that had an amazing ability to closely track the historical market action. Overall, it was not an impressive piece of advertising to me but I always assume that this type of marketing must work. If the marketing was ineffective, the marketers would probably not continue sending so many ads.
While this email failed to impress me, this piece of marketing is worth thinking about for several reasons.
Members of the MTA realize
To view this content you must be an active member of the TAN Association.
Not a member? Join the TAN Association and unlock access to hundreds of hours of written and video technical analysis content, including the Journal of Technical Analysis and the Video Archives. Learn more about Membership here.
Contributor(s)

Michael Carr, CMT
Mike Carr, who holds a Chartered Market Technician (CMT) designation, is a full-time trader and contributing editor for Banyan Hill Publishing, a leading investment newsletter service. He is an instructor at the New York Institute of Finance and a contributor to various...
MEMBER PROFILE: DR. JULIE DAHLQUIST, PH.D., CMT
Julie Dahlquist is first and foremost a teacher. She may not try to be teaching all the time but she taught me a great deal in a short time. Great teachers have the ability to make complex ideas easy to understand. Julie demonstrated this skill when she explained the relationship between economics and technical analysis.
My B.B.A. and Ph.D. are both in economics. I am often asked how an economist can become a technical analyst. However, I do not see economics and technical analysis at odds with each other. That supply and demand determine price is at the heart of economics. To me, technical analysis is nothing more than looking at the relationship between supply and demand.
That sounds simple enough but she has actually incorporated the two disciplines in a way that seems to be unique. In an easy to  understand
To view this content you must be an active member of the TAN Association.
Not a member? Join the TAN Association and unlock access to hundreds of hours of written and video technical analysis content, including the Journal of Technical Analysis and the Video Archives. Learn more about Membership here.
Contributor(s)
Amber Hestla-Barnhart
THE TECHNICAL TAKE
Editor’s note: This is an extract of an internal, weekly macro technical research report written solely to address the concerns of the Quantitative Strategies Group (QSG) at ICC Capital Management Company. The topics and layout are designed specifically for the needs of QSG in terms of content and formatting. This report was prepared on August 23, 2013 and opinions expressed in this report may have changed since then. It is reprinted here with permission of the author because it shows a consistent approach to intermarket analysis that many readers may find useful.
Report Summary
- Gold (GLD) / 20 Year Treasury Bond Price (TLT) relative strength remains bullish on the short term, consolidative on the intermediate term and bearish on the long term which is indicative of low inflationary pressure.
- Commodity (CCI) / S&P 500 (SPX) relative strength remains bearish on all time frames.
- The 10 Year Treasury Yield (USGG10YR) weekly candlestick chart remains bullish
To view this content you must be an active member of the TAN Association.
Not a member? Join the TAN Association and unlock access to hundreds of hours of written and video technical analysis content, including the Journal of Technical Analysis and the Video Archives. Learn more about Membership here.
Contributor(s)

Robert Dombrower
Robert Dombrower is a Vice President and Senior Portfolio Specialist at Jackson National Asset Management in Denver, Colorado. Robert spearheads Jackson's technical research effort through the creation and implementation of quantitative technical analysis overlays, qualitative...
VISUAL GUIDE TO ELLIOTT WAVE TRADING
Elliott Wave is often thought of as a comprehensive market philosophy. It can be applied as a self-contained analytical tool but Gorman and Kennedy demonstrate that Elliott Wave can be combined with other indicators to potentially increase returns and decrease risk. The use of additional indicators is rarely seen with Elliott Wave analysis but this book demonstrates how to add momentum or an overbought/oversold indicators.
In Visual Guide to Elliott Wave Trading, Gorman and Kennedy explain how to apply Elliott Wave and more importantly how to trade Elliott Wave.
One of the advantages of Elliott Wave is that it provides a way to forecast market turning points. Analysis often begins with a study of the past market action to determine which wave is unfolding now. That information is useful to traders but no tool is ever 100% accurate. A simple idea, adding MACD or
To view this content you must be an active member of the TAN Association.
Not a member? Join the TAN Association and unlock access to hundreds of hours of written and video technical analysis content, including the Journal of Technical Analysis and the Video Archives. Learn more about Membership here.
Contributor(s)

Wayne Gorman
Wayne Gorman is a Senior Tutorial Instructor at Elliott Wave International. With more than 30 years of experience as a risk manager and trader, he began his career at Citibank managing money market and derivative portfolios, and then went on to forex trading and various treasury...

Jeffrey Kennedy, MSTA, CFTe, CMT, CEWA-M
Jeffrey Kennedy, who holds the Chartered Market Technician (CMT) designation, is Chief Commodity Analyst at Elliott Wave International (EWI) with over 25 years of experience as an analyst, trader and teacher. He writes Commodity Junctures, EWI's premier commodity...
Michael Carr, CMT
Mike Carr, who holds a Chartered Market Technician (CMT) designation, is a full-time trader and contributing editor for Banyan Hill Publishing, a leading investment newsletter service. He is an instructor at the New York Institute of Finance and a contributor to various...
Q&A WITH WAYNE GORMAN
Editor’s note: After reading the book, I wanted to know more about how to trade Elliott Wave. Wayne kindly answered several questions and his answers may help others trying to incorporate Elliott Wave into their trading process.
Your book stressed risk management. Would you say Elliott Wave is a risk management framework?
No, not in the sense of measuring and evaluating “Value at Risk,” which is a statistical concept. Elliott wave is a forecasting model that can be used to create a trading framework.
You also provide examples from various markets demonstrating EW. Do you think EW works in all markets, even when government or central banks exert pressure on prices like they do with QE?
One can apply Elliott wave to any trading market that’s free and liquid. The underlying premise is that crowd behavior results in price movements that are patterned after the Wave Principle. Governments and central banks are just as
To view this content you must be an active member of the TAN Association.
Not a member? Join the TAN Association and unlock access to hundreds of hours of written and video technical analysis content, including the Journal of Technical Analysis and the Video Archives. Learn more about Membership here.
AN OVERVIEW OF MARKET ACTION IN THE PHILIPPINES
Philippines Stock Exchange PSEi Index Outlook
Editor’s note: This analysis was prepared on August 28, 2013.
The PSEi fell as low as 5,562 in today’s trading following last night’s sell-off of emerging market shares in the U.S. Fortunately, the PCOMP managed to surface above its support at its June low to close the session at 5,738. Bargain hunting in anticipation of a better-than-expected Philippine GDP report allowed the index to recover part of its losses and as a result formed what appears to be a bullish hammer candlestick pattern. With prices at support and an oversold condition, the index may stage a rally in the very near term. A bounce off its present support may send it back to 5,900 or even to 6,100. Note, however, that any rally may still be temporary as this may mark the last rally of the wave C of a wave 4 correction. Following this rally,
To view this content you must be an active member of the TAN Association.
Not a member? Join the TAN Association and unlock access to hundreds of hours of written and video technical analysis content, including the Journal of Technical Analysis and the Video Archives. Learn more about Membership here.
Contributor(s)

Ron Acoba, CMT
Ron Albert Acoba, CMT, is Chief Investment Strategist for Trading Edge Consultancy. Prior to that, he was an equity dealer for Credit Suisse Philippines and an equity fund manager for BPI Asset Management & Trust Group. Blogs with updates to the market action can be found at...
CHART OF THE MONTH
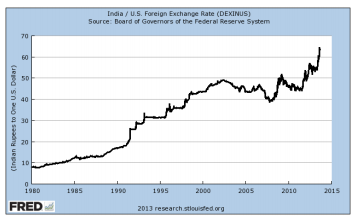
This month, several charts are shown to allow for a more detail look at India. A number of news stories have pointed out that rapid changes in the exchange rate of the Indian Rupee could lead to economic problems for the nation. The Rupee is at an all-time high against the U. S. dollar.
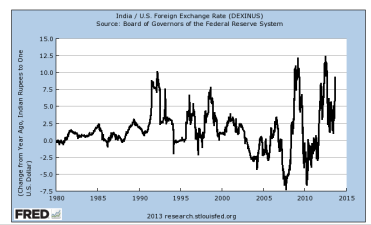
The one-year rate of change (ROC), however, is not yet at record levels indicating the problem could worsen.
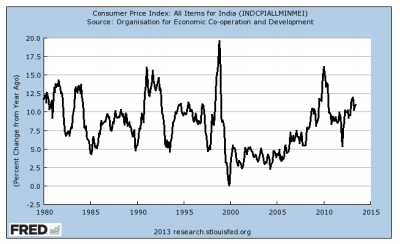
As the Rupee fell, prices have increased and the one-year ROC in the Consumer Price Index has been over 10% for some time.
Stock prices have been falling. The monthly
To view this content you must be an active member of the TAN Association.
Not a member? Join the TAN Association and unlock access to hundreds of hours of written and video technical analysis content, including the Journal of Technical Analysis and the Video Archives. Learn more about Membership here.
New Educational Content This Month
-
August 26, 2020

The CMT Experience
Presenter(s): Tyler Wood, Dave Lundgren, CMT, CFA
-
August 26, 2020
Reading the Current Market in Light of History’s Lessons
Presenter(s): Ryan Detrick, CMT
-
August 12, 2020
How to Spot Major Trend Reversals with Elliott Waves and Socionomics: Examples from Asia’s Ongoing Secular Bull Market
Presenter(s): Mark Galasiewski